The results of a number of calculation lines are added via
Calculate
- Sum of calculated lines - Create. Information about the format
and unit of measurement is gathered from the table's last calculation
line. Nesting of several additions is unfeasible.
The result can
be assigned a variable. The text previous to the table result is
automatically queried and can be freely selected. This variable may be
modified at all times (see below).
If calculation lines in the
table are deleted or modified or lines are copied into the table, the
result is automatically adjusted. All calculations depending on the
result are updated.
Important: The tables are
provided with beginning and end marks (display with CTRL+M). This
bracketing must be marked, while copying, deleting and cutting.
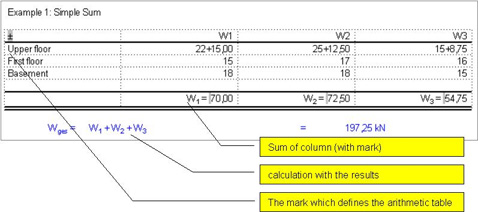
Example
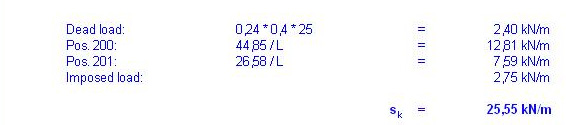 Generating a summation
- With the mouse: Mark the lines and call up the Sum of calculated lines
function in the context menu (right mouse key).
- Via the keyboard: Call up the Calculate - Sum of calculated lines - Create
function. A blank line must be inserted prior to the first and last
calculation line for correctly allocating the table when using F12.
Modifying a summation
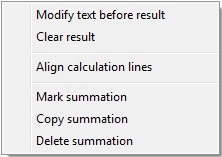
- Clear result: Click on the result and call up Clear
Result in the context menu.
- Changing text or variable:
One of the simplest methods is clicking on the result and calling up
the Text before result function in the context menu.
Result single-lined/right
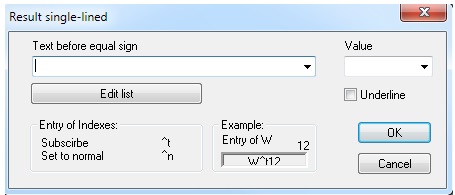
This feature has been realized mainly for the reason to right-justify
special values and to visually adopt the look of a summation (see
Example 1).
The line is blocked after
an entry, but can be
re-activated or modified by using the context menu with
Modify calculation line or
with ALT+ENTER.
The Main Principle
The addition of calculation lines mentioned above is often sufficient
for simple calculations.
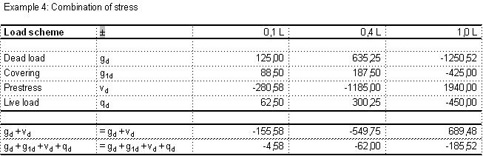
However the classic tabular form is
often more space-saving and more clearly arranged. We never intended to
develop a new spreadsheet program. The goal was to provide an efficient
tool for supporting the compilation of cross-section values, stresses
and strains in tabular form. Additionally such tables are implemented
into the existing calculation concept, so the results can be used for further
calculations.
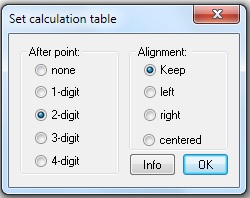
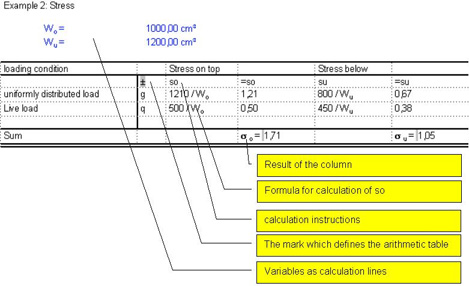
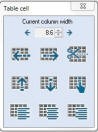
A marker is set in a table. This defines the number of decimal places
for the result and the alignment of columns. (see figure).
Specifications for the calculating component can be entered in lines
and columns behind or below this marker. This defines variables and
formulae. Formulae start with a "=" (see below).
Example 1
Example 2
Additional information on design
Headings and units of measurement are usually specified before the
expression. If the expressions are hidden, it is sensible to
specify headings explicitly. For simple cases it is sufficient if the
expression is used as a heading. Please note that either
all arithmetic
expressions or
no arithmetic expressions within a document are hidden.
Therefore it is recommended not to mix different practices.
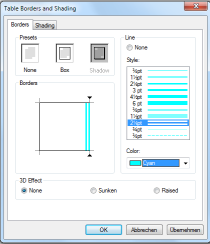
The
lines are drawn with the
Frame and Shading function (see
on the right). The
function can be called up via the context menu.
Alternatively the toolbox

is available.
Tables that have been created with other programs can be integrated using
OLE technology. The precondition is that the program is OLE-compatible which is normally the case with standard software.
Example: Displaying an EXCEL* calculation (right) in VCmaster (left):
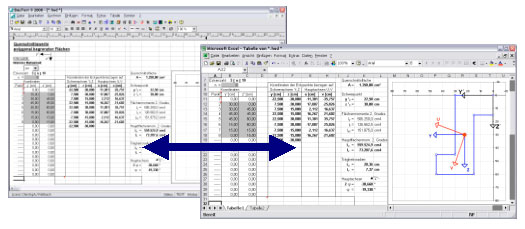
Additional notes on the OLE interface are given in the Chapter "
OLE interface"
*EXCEL is a registered trademark of Microsoft Inc.